Lessons learnt from Hacklytics 19 @ Georgia Tech
hackathonI joined Chandini Soni, Preeti Chayapathi, and Emily Huskins, fellow Master of Analytics and Computer Science students to participate in Hacklytics 2019 at Georgia Tech, a data science hackathon in February. This is the first hackathon I joined that emphasizes community impact and it was fulfilling to see our 12-hour proof-to-concept come into fruition.

Our project, called Eagle Eye Watch, is an analogy for monitoring public affairs closely for any anomalies like an eagle watching its prey. We obtained 20 years worth of Atlanta City Council data online with BeautifulSoup and parsed the pdf through Python for natural language processing for three purposes: 1) monitoring meetings attendance, 2) key resolutions summarization, and 3) tracking topic over time. In essence, we turned boring 900-page-long-PDFs into easily understanding charts and summaries to help keep the public informed!
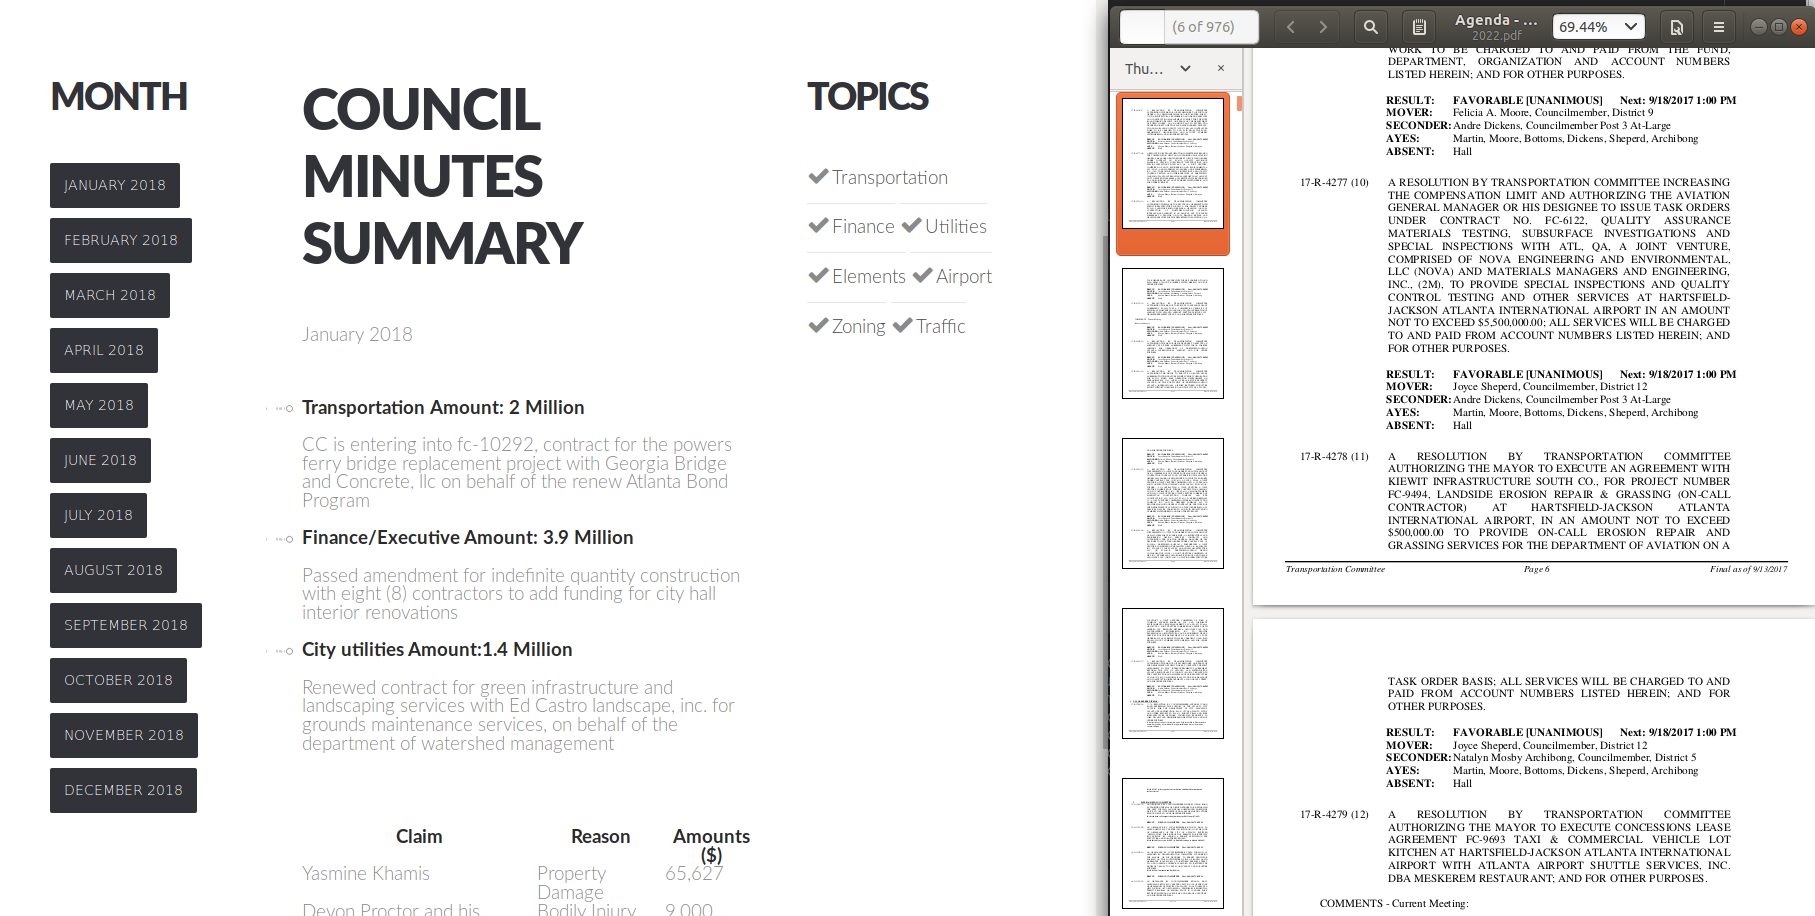
Caption: Text summarization helped capture key information and important stakeholders of resolution (on the right - 976 pages long meeting minutes)
The post is not a technical discussion but on the three lessons I learnt from the hackathon.
- Defining problem statement
In class, we learn what a k-means algorithm is, what a neural network model does, but working with real dataset and create something with community impact requires something beyond making a model. By asking the right questions, which is often an exploratory process, we gradually discovered what would be the value-add in analyzing our city council minutes datasets. During the exploratory time, we asked ourselves, who attended the meetings the most? Who was on time to most? What kinds of topics were discussed the most? How can we turn these long, dense PDFs into some key insights that are easier to read? These questions drove us to create visualizations that really serve the need for monitoring civil servants and how they allocate resources into different areas.
- Data Cleaning and data cleaning and data cleaning…
There is a common saying that data cleaning is 90% of the work in data science. We could not agree more to that. We spent a lot of time working on regular expressions, parsing strings, before passing the text into NLP and topic modeling modules. Indeed, how much we cleaned the data significantly influenced how well we could summarize key information from the data.
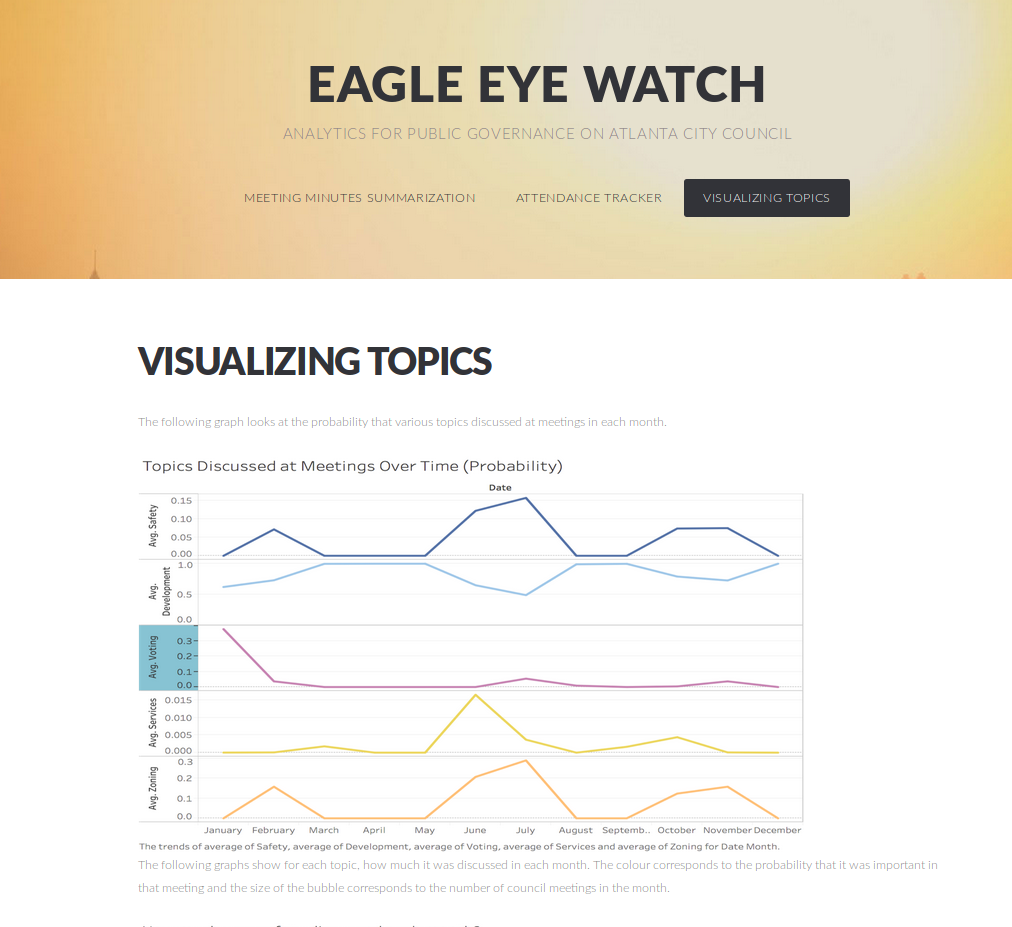
Caption: Easily intepretable graphs from topic modeling track topics discussed during a year worth of city council meetings
- Data Science is a story-telling process
During the hackathon, there were many teams who focused on deep learning, image processing, time-series forecasting and so on. We presented our project as one that is purpose-driven for serving the public. We effectively conveyed the message through visualizations of attendance records and topic modelling. These graphs contain messages and stories to drive home the point that these meeting minutes are trough of information from which we can unlock tremendous values for public governance.
At the end of the day, I really enjoyed being able to ‘hack’ a problem with good friends over a few meals, and github things together. It is rewarding for me to be able to use my analytics skills to create something practical for public good. I am really inspired to come up with the next project to explore text summarization (maybe with Deep Learning next time) further. Thank you Chandini, Preeti, and Emily for the good times and camaraderie!